Surging Seas [2013–2016]
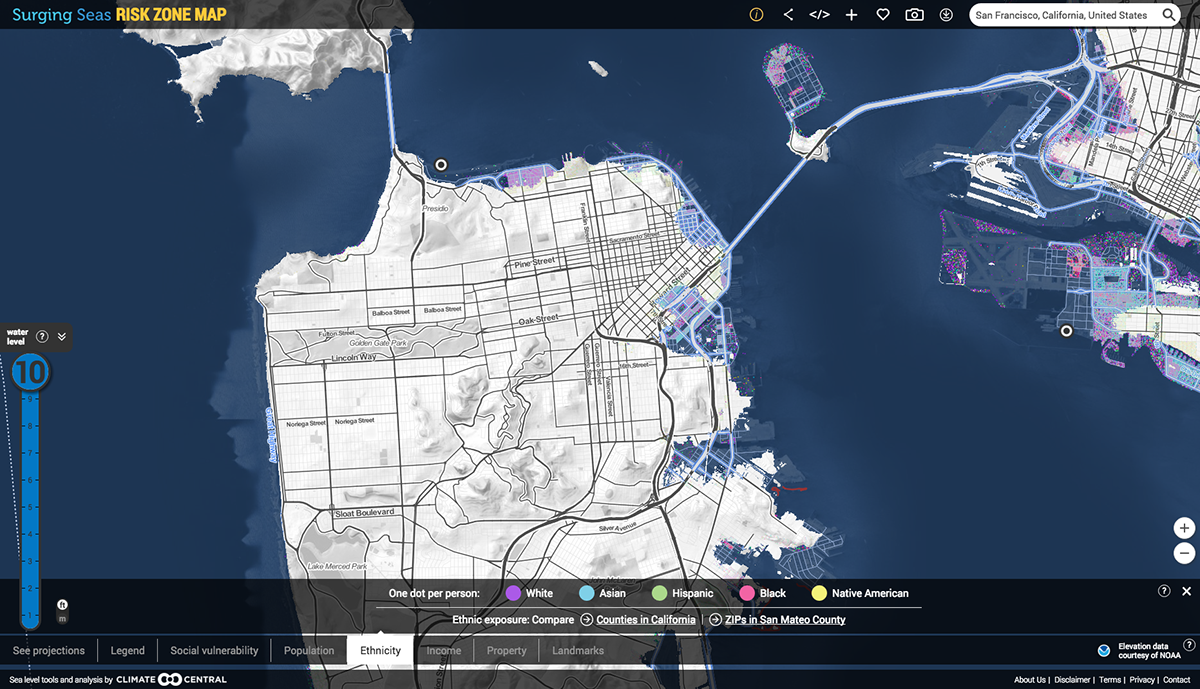
The Surging Seas project is an interactive map that combines sea level rise with various economic and population indicators.
Most maps of sea level rise are underwhelming visually. By focusing on the land that’s shrinking as sea levels change, they give the impression that there’s lots of land left over, even after the oceans change the shape of the coastline.
We inverted that pattern by placing the visual emphasis not on the land that’s left over as the ocean rises, but on the land that’s lost. Ten feet sounded like an unrealistically high number when we started the project, but Sandy’s storm surge of 13 feet changed our minds pretty quickly.
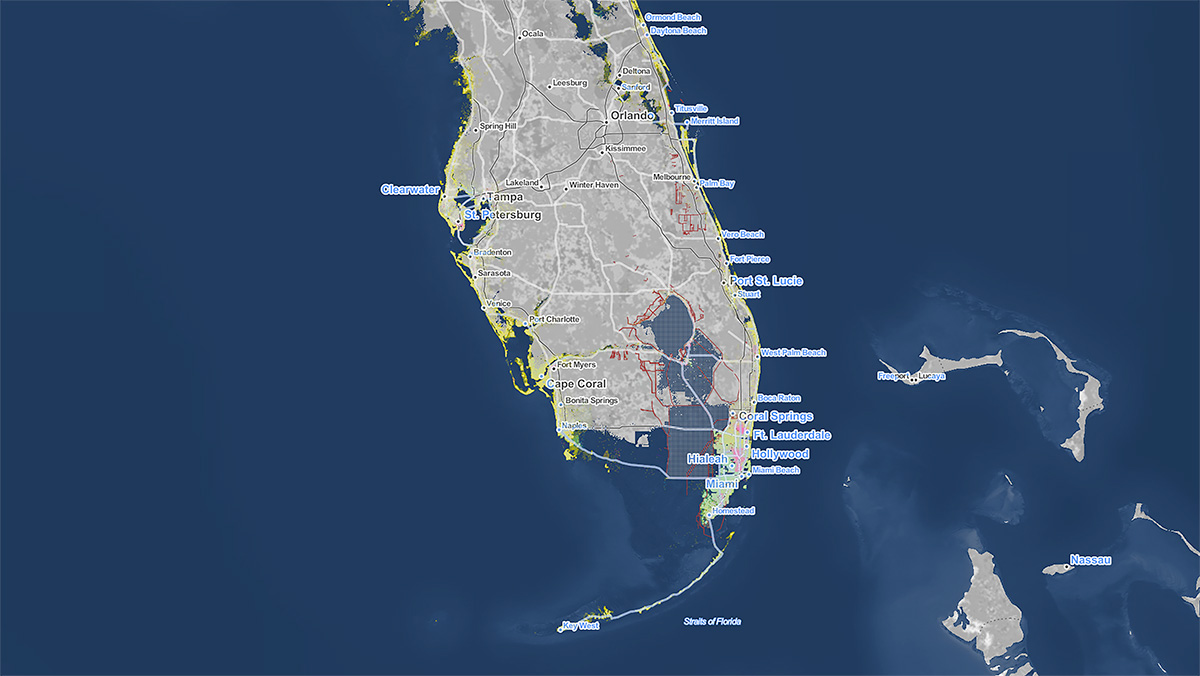
South Florida under 10 feet of water
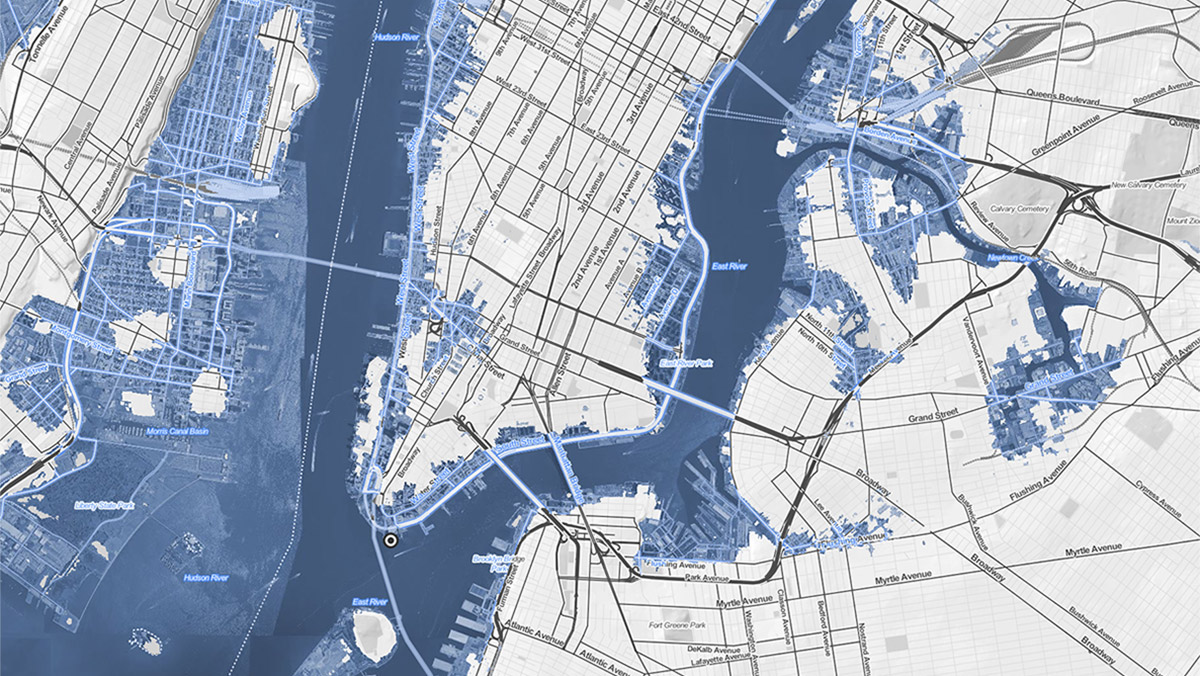
NYC under 10 feet of water


